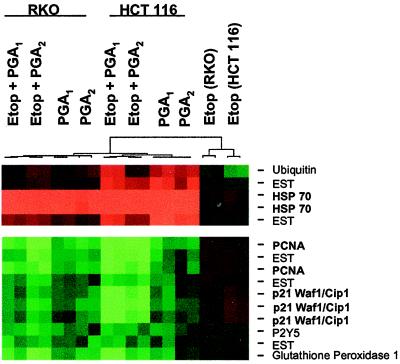
Figure 2.
Gene expression analysis in RKO and HCT 116 cells incubated with electrophilic PG. The horizontal segments, in duplicate, (left to right) depict the “cluster” analysis for RKO cells treated with 50 μM etoposide (Etop) plus 20 μM PGA1, 50 μM etoposide plus 20 μM PGA2, 20 μM PGA1, or 20 μM PGA2; HCT 116 cells treated with 50 μM etoposide plus 20 μM PGA1, 50 μM etoposide plus 20 μM PGA2, 20 μM PGA1, or 20 μM PGA2; RKO cells treated with 50 μM etoposide alone; and HCT 116 cells treated with 50 μM etoposide alone. Green rectangles depict seven genes [proliferating cell nuclear antigen (PCNA), p21, P2Y5, glutathione peroxidase, and three expressed sequence tags (ESTs)] whose expression fell by >2-fold in all treatment groups, compared with that in treatment with etoposide alone. Red rectangles depict four genes [heat-shock protein (HSP)-70, ubiquitin, and two expressed sequence tags] whose expression rose by >2-fold in all treatment groups, compared with that in treatment with etoposide alone. The dendrogram shows that differential gene expression in samples treated with PGA1 or PGA2 diverges from gene expression in samples treated with etoposide alone.

