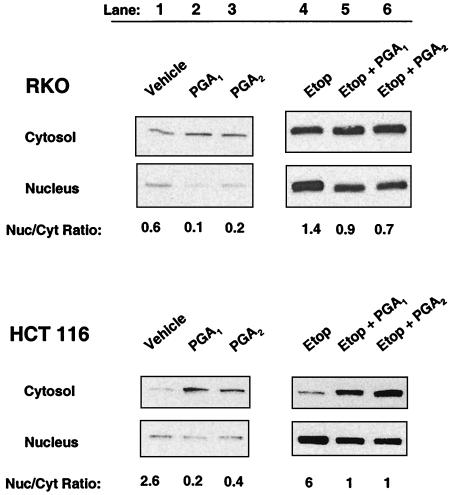
Figure 4.
Subcellular distribution of wild-type p53 in RKO and HCT 116 colon cancer cells treated with electrophilic PG. Cytosolic and nuclear distribution of p53 protein in RKO cells (Upper) and HCT 116 cells (Lower) incubated with DMSO vehicle (lane 1), 20 μM PGA1 (lane 2), 20 μM PGA2 (lane 3), 50 μM etoposide (Etop; lane 4), 50 μM etoposide plus 20 μM PGA1 (lane 5), or 50 μM etoposide plus 20 μM PGA2 (lane 6). Lanes represent a constant percentage of total protein from the nuclear and cytosolic fractions of identical samples. The number below each lane is the nuclear/cytosolic (Nuc/Cyt) ratio estimated by densitometry.

