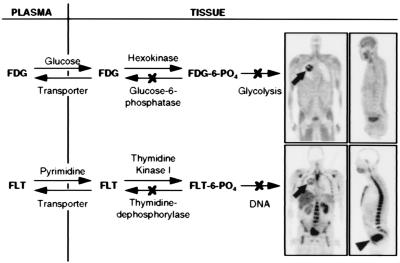
Figure 2.
Tracer kinetic models for FDG and FLT. Arrows show forward and reverse transport between plasma and tissue, phosphorylation and dephosphorylation. Both FDG and FLT phosphates are not significant substrates for dephosphorylation or further metabolism at normal imaging times of 40–60 min after injection. Models taking dephosphorylation reaction into account at much later imaging times have been developed (7, 9). Images are 6-mm-thick longitudinal tomographic sections of a patient with a lung tumor (arrows), with high glucose metabolism and DNA replication. The rest of the images show normal distribution of glucose utilization and DNA replication, exceptions being clearance of both tracers to bladder (arrowhead) and, in the case of FLT, the glucuronidation by hepatocytes (12) in liver.

