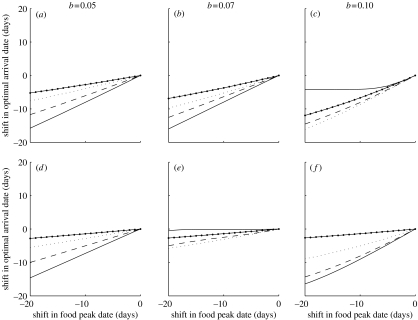
Figure 1.
Optimal shift in arrival date as a response to an advancement of food peak date for different mortality risks. The standard deviation of the food distribution (σ) is 5 (solid line), 10 (dashed line), 20 (dotted line) or 40 (solid line with dots). In (a–c), the competition for territories is weak (z=0.01) and in (d–f) competition is strong (z=0.1). The value of μ before the shift in food peak date was 150. Other parameter values are x1=10, x2=50 and λmax=170.

