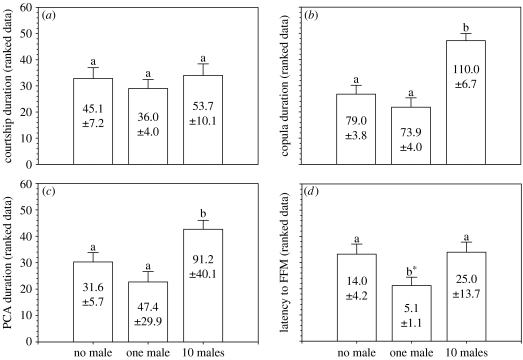
Figure 1.
(a) Courtship duration, (b) copula duration, (c) duration of PCA and (d) latency to a FFM in each of the three treatments: ‘no male’ (i.e. low SCR), ‘one male’ (i.e. high SCR) and ‘10 males’ (i.e. certain SCR and high SCI). Bar plots show data after rank transformation, as used in statistical analyses, but descriptive statistics of the raw data (, s) are provided within each bar. Bars with different letters have statistically significant differences (α<0.05) except in (d), where significant differences were detected by a post hoc trend analysis.

