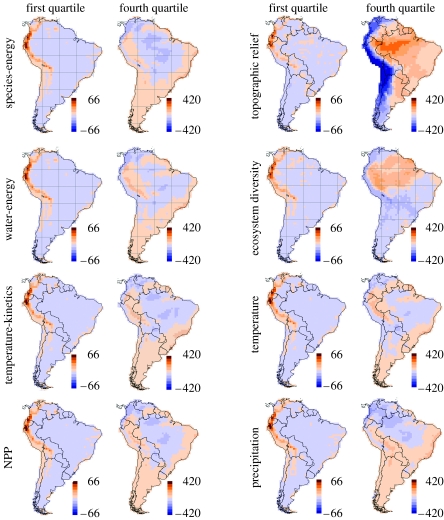
Figure 2.
Spatial distribution of residuals (observed minus expected bird species richness) from range cohesion models. Results are shown for subsets of endemic species partitioned into geographical range-size quartiles for the first (smallest ranges) and fourth (largest ranges) quartiles for eight environmentally driven models. Note that the colour scale differs for the quartiles.

