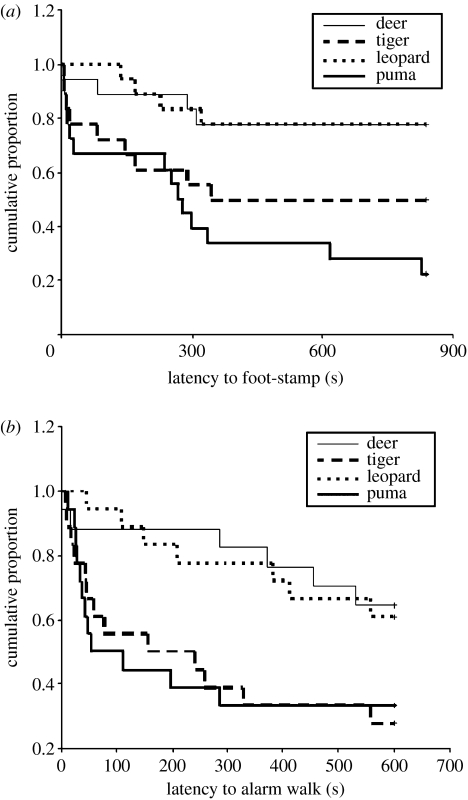
Figure 3.
Plots of Kaplan–Meier survivorship functions of latencies to (a) foot-stamp and (b) alarm walk to each model. (a) Pairwise comparisons indicate statistically significant differences (p<0.05) between the puma and deer models and between the puma and leopard models (npuma=19, nleopard=ntiger=ndeer=18). (b) Pairwise comparisons indicate that both the puma and tiger models are statistically significantly different (p<0.05) from both the deer and leopard models (ndeer=17, ntiger=nleopard=npuma=18).

