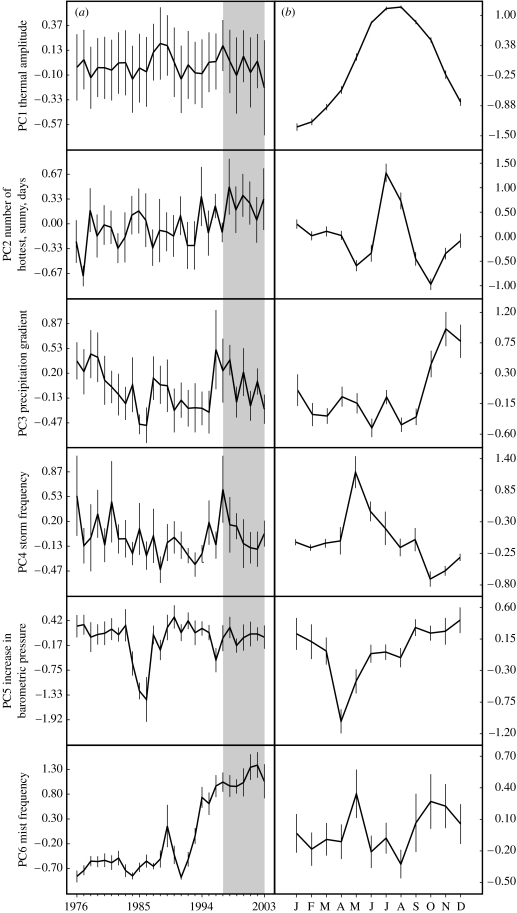
Figure 1.
(a) Yearly and (b) monthly variation in the climatic characteristics of an alpine area of the Sierra de Guadarrama. Sample size is 12 months for each year and 28 years for each month. Values represented are mean±1 s.e. Within grey areas are included the years of observed chytridiomycosis infection in the amphibian populations of Peñalara area. For significance of differences among years and months, see table 1.

