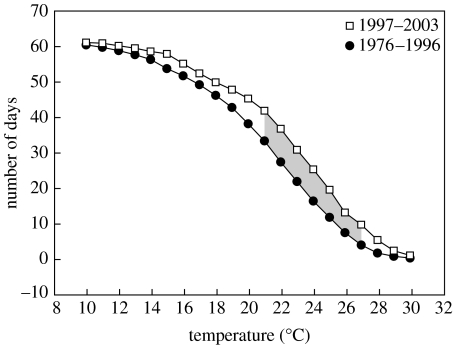
Figure 2.
Variation in the number of days (ordinate) with maximum temperatures higher than several temperature values (abscissa) in the time-interval 15 July to 15 September. Two time periods are compared according to lack (1976–1996) or presence (1997–2003) of chytridiomycosis. The grey area denotes significant differences in the t-tests comparing these two time periods (p<0.05).

