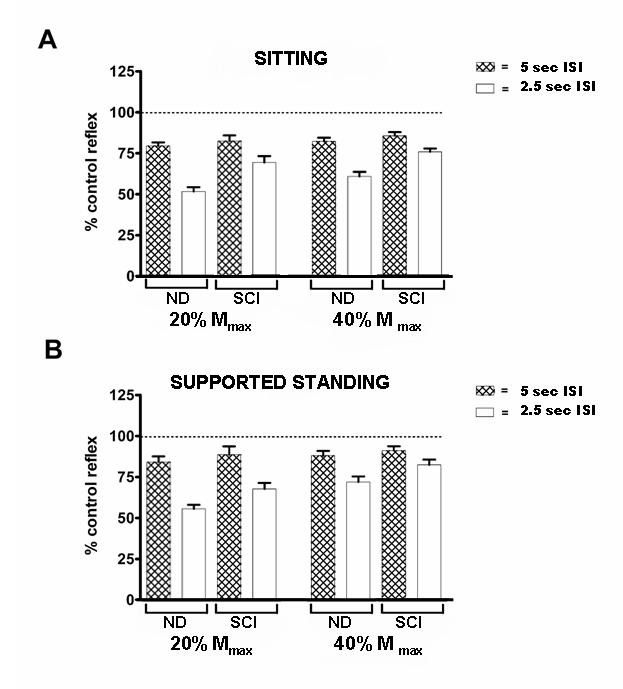
Figure 1.

The effect of ISI, amplitude of the evoked reflex and postural condition on the post-activation depression (PAD) of the soleus H-reflex. All data is expressed as a percentage of the control reflex under the same postural condition. Hatched bars indicate reflexes evoked with ISIs of 5 sec, open bars indicate reflexes evoked with 2.5 sec ISIs. Error bars indicate the standard error of the mean (SEM)
