Figure 1.
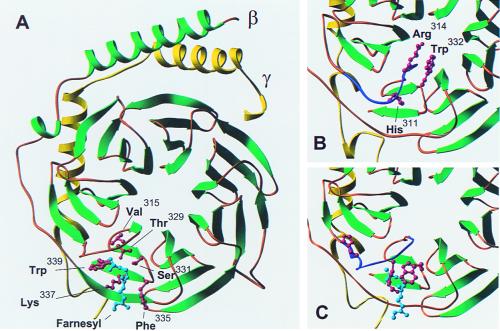
Important features of the C-terminal region of Gβ. (A) The structure of Gβγ containing the farnesyl lipid derived from the β1γ1–phosducin complex as determined by Loew et al. (12). Gβ is shown in green and Gγ in yellow. The farnesyl group at the C terminus of Gγ is shown in cyan. The six amino acids predicted to interact with the farnesyl group based on the x-ray structure of the phosducin–β1γ1 complex are shown in red as ball-and-stick models. (B) The structure of free β1γ1 as determined by Sondek et al. (9). The molecule was placed in an identical orientation to the βγ structure shown in A by using the program O. Only the lower left corner of Gβγ is shown. The region of Gβ (Gly306–Gly319) that undergoes a conformational change when the dimer interacts with phosducin is shown in purple. Three amino acids that undergo dramatic conformational changes on formation of the phosducin–β1γ1 complex are shown as red ball-and-stick models. (C) The region of Gβγ shown in B from the βγ–phosducin complex determined by Loew et al. (12). The amino acids between Gly306 and Gly319 are shown in purple. The dramatic conformational changes in the side chains of His311, Arg314, and Trp332 are indicated by the red ball-and-stick models. The illustrations of Gβγ were generated with the program ribbons.

