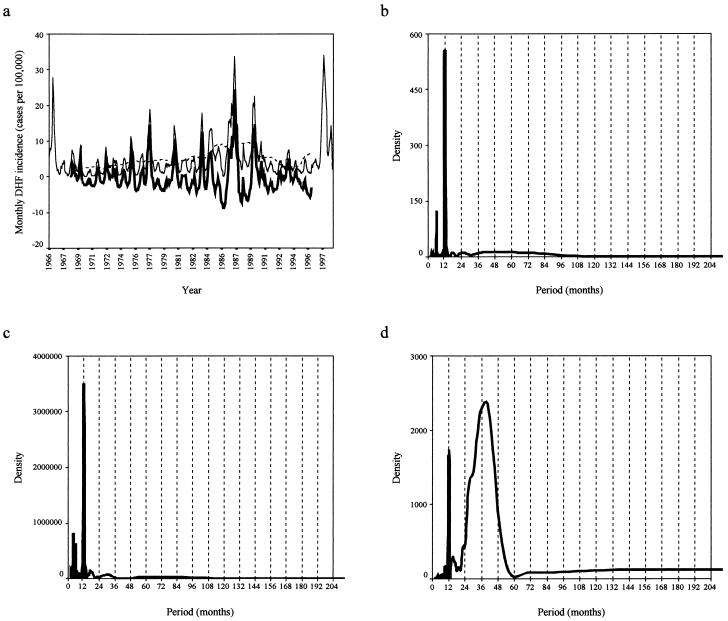
Figure 1.
(a) A line graph showing the monthly incidence (cases per 100,000) of DHF in Bangkok from January 1966 to December 1998. The dashed line shows a moving average of 61 months and the bold line, the stationary DHF incidence series (original value − moving average) on which SDA was performed. (b–d) The spectral density plots of mean monthly temperature (b), total monthly rainfall (c), and total DHF incidence (d) for Bangkok are shown. A Tukey–Hamming window of three points was applied to smooth the spectral density plots. Details of the variance structure from the periodograms (unsmoothed spectral density plots of frequency) show that annual and short frequencies account for 31.5% of the total variance in the DHF time series and superannual frequencies account for 68.5%. For the temperature and rainfall time series, the annual/superannual variance split is 92.5:7.5 and 94.0:6.0, respectively.

