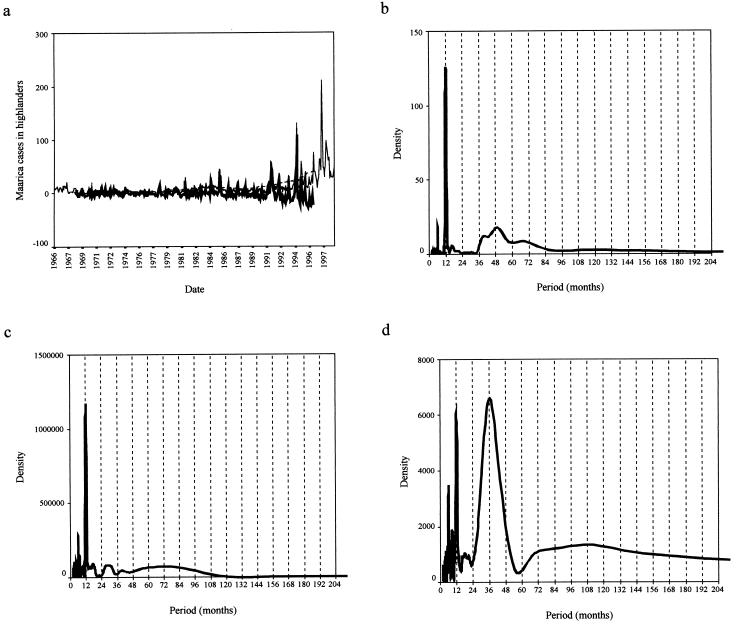
Figure 2.
(a) A line graph showing the monthly incidence (cases per 100,000) of P. falciparum malaria incidence (cases per 100,000) in Kericho from January 1966 to December 1998. (b–d) The SDA of mean monthly temperature (b), total monthly rainfall (c), and total malaria incidence (d) for Kericho are shown. As for Fig. 1 b–d, except that annual and shorter frequencies account for 69.8% of the total variance in the malaria time series and superannual frequencies account for 30.2%. For the temperature and rainfall time series the annual/superannual variance split is 82.1:17.9 and 89.1:10.9, respectively.

