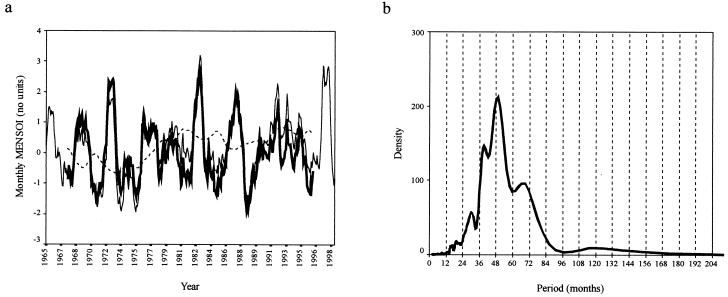
Figure 3.
(a) A line graph showing the monthly MENSOI from January 1966 to December 1998. (b) SDA plot of the MENSOI. As for Fig. 1 b–d, except that details of the variance structure from the periodogram show that annual and shorter frequencies account for 4.5% of the total variance in the MENSOI time series and superannual frequencies account for 95.5%.

