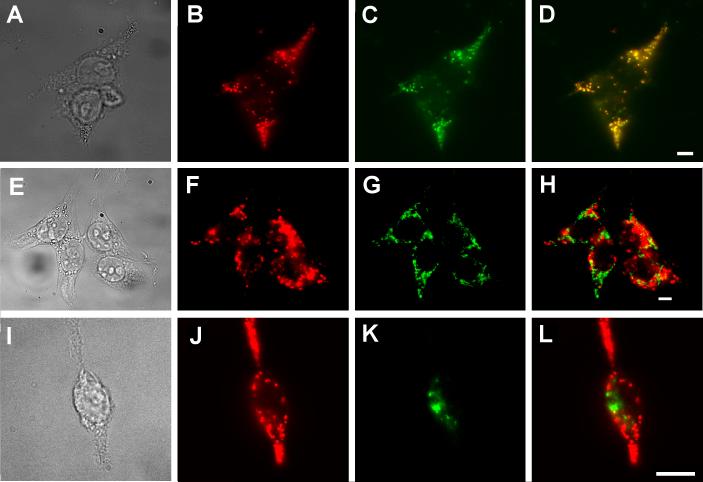
Fig. 2.
Colocalization of PfCRT and LAMP-2. Bright field (A, E, I) and epifluorescence images (B-D, F-H, J-L) of doubly labeled, PfCRT-expressing HEK293 cells, probed with rabbit anti-PfCRT antibodies detected via Cy3-secondary anti rabbit IgG antibodies (B, F, J; red), as well as mouse monoclonal antibodies against LAMP-2 (C), calnexin (G) or GM-130 (K), detected with Alexa Fluor 488-labeled secondary anti-mouse IgG antibodies (green). (D, H, L) Overlays of the red and green channels. Yellow indicates areas of overlap. Scale bar = 10 μm.

