Fig. 5.
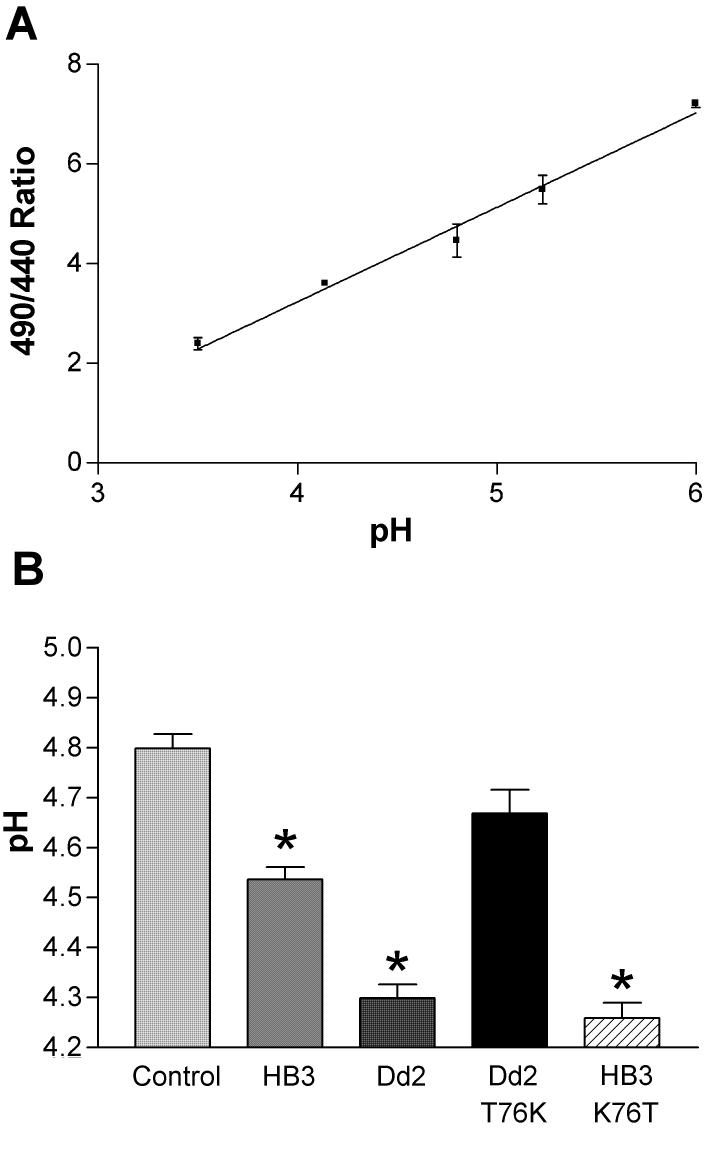
Measurement of lysosomal pH in cells transfected with pfcrt. (A) Calibration curve for the pH dependent fluorescence of Oregon Green 488 dextran in lysosomes. Cells loaded with Oregon Green 488 dextran were equilibrated with solutions of known pH in the presence of the ionophores nigericin and monensin. The ratio of the fluorescence emission intensity of the Oregon Green 488 dextran loaded cells due to excitation at 490 and 440 nm was determined as a function of bath solution pH. (B) The lysosomal pH is more acidic in cells expressing the PfCRT isoforms HB3-RFP or Dd2-RFP than in RFP transfected control cells. Lysosomal pH was measured in live cells using Oregon Green 488 dextran. The RFP fluorescence allowed rapid identification of transfected cells. The mean lysosomal pH for HB3-RFP- or Dd2-RFP-transfected cells are shown, along with mean pH measured for the reversal mutants HB3-RFP-K76T and Dd2-RFP-T76K. Control cells were transfected with RFP alone. Error bars indicate S.E.M. and asterisks (*) indicate significant differences from control, as determined by one way ANOVA with Bonferroni multiple comparison post-test (p < 0.05).

