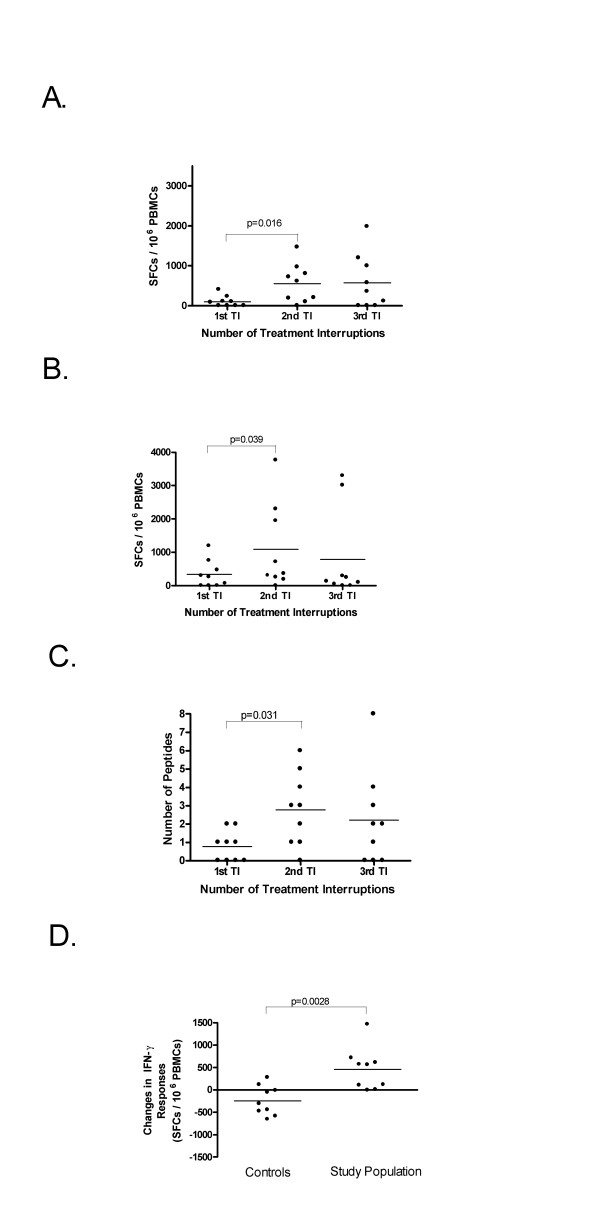
Figure 3.
Comparison of the magnitude and breadth of HIV-specific responses between TI#1, TI#2, and TI#3. A. The magnitude of responses to peptide panels increased significantly by a mean of 457 SFC/106 PBMC from TI#1 to the TI#2 (p = 0.016), and 20 SFC/106 PBMC from the TI#2 to TI#3 (n.s.). B. The magnitude of responses to Gag p55 peptide pools increased by a mean of 754 SFC/106 PBMC from the TI#1 to TI#2 (p = 0.039), and decreased by a mean of 302 SFC/106 PBMC from the TI#2 to TI#3 (n.s) C. The breadth of responses to the HIV peptide panels used for screening increased significantly by a mean of 2.00 peptides from the TI#1 to TI#2 (p = 0.031) and decreased by a mean of 0.56 peptides from the TI#2 to TI#3 (n.s.) D. Comparison of the magnitude of the change in IFN-γ responses from the first to the second time point tested in continuously treated HIV-infected subjects (controls) and between TI#1 and TI#2 in the study population. The bar in each scatter plot shows the mean change in SFC/106 PBMC. The magnitude of the change differed significantly between the controls and the study population (-240 ± 331 versus +457 ± 475 SFC/106 PBMC respectively, p = 0.0028; Mann-Whitney test); n.s.= not significant.

