Figure 6.

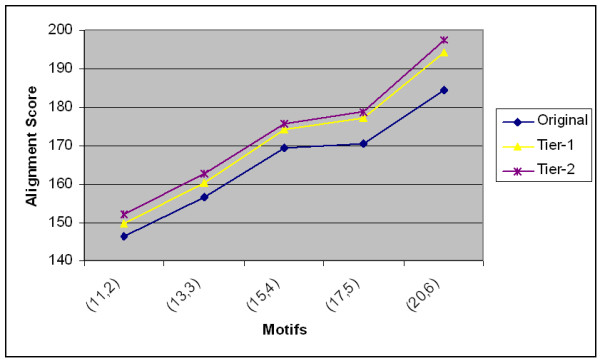
The average scores with the corresponding first tier and second tier improvements on synthetic data using the Random Projection with Exit-point approach with different (l, d) motifs.

The average scores with the corresponding first tier and second tier improvements on synthetic data using the Random Projection with Exit-point approach with different (l, d) motifs.