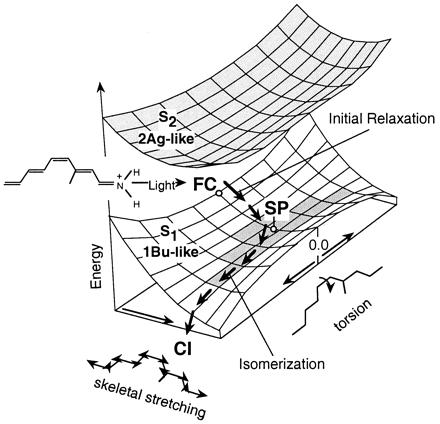
Figure 2.

Structure of the S2 and S1 energy surfaces along the S1 reaction path for the PSB11 model 1. The stream of arrows on the S1 surface represents the reaction path. Point SP corresponds to a planar species where the torsional deformation leading to the S1 → S0 decay channel (CI) begins. The shaded area on the lower surface corresponds to an extended energy plateau.
