
Figure 3.
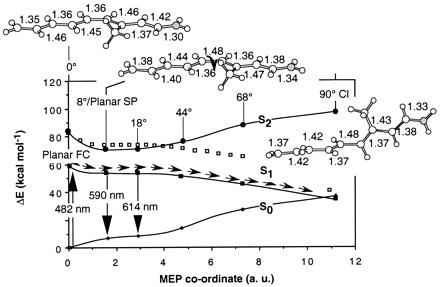
Energy profiles along the S1 photoisomerization coordinate of 1. The structures (geometrical parameters in Å and degrees) document the progression of the molecular structure along the coordinate (see ref. 16). ■ show the CASPT2 S1 energy profile, and □ show the CASSCF energy profile before PT2 correction. ● and ♦ show the CASPT2 S2 and S0 energy profiles along the same coordinate, respectively. Notice that, because of the S1/S0 curve crossing, at the 90° CI structure the state labeled S0 is ca. 1 kcal⋅mol−1 higher than that labeled S1. For the sake of simplicity we maintain this inverted labeling throughout the paper.