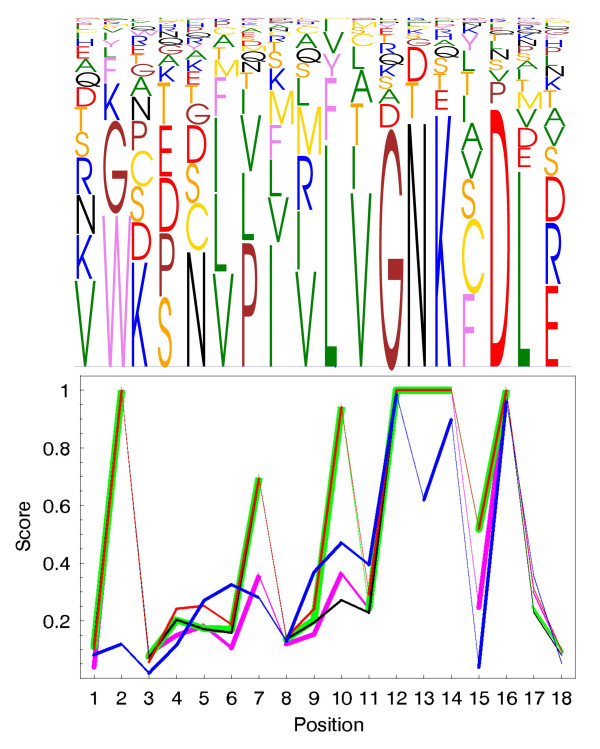
Figure 1.
MultiDisp visualization of part of the Ras-like proteins (upper) and the corresponding scaled -log(p)-values (lower). The curves show the p-values calculated using (red) Blosum62, (green) Gonnet250, (black) PAM250, (magenta) identity scoring matrices and (blue) classification of the amino acids for the Ras-like proteins.

