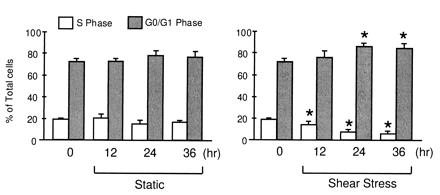
Figure 5.

Modulations of BAEC cell cycle by laminar shear stress. Open bars represent S phase; shaded bars denote G0/G1 phase. The data plotted are mean ± SD from four independent experiments. * denotes P < 0.05 compared with the corresponding controls kept under static condition for the same lengths of time. (Left) Results on ECs under static condition. (Right) Results on ECs under laminar shear stress of 12 dynes/cm2.
