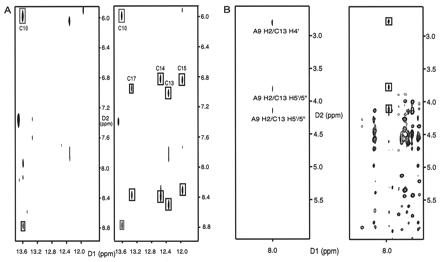
Figure 3.

NMR evidence for the formation of the kissing complex of H3–18. (A) A comparison between the 15N-14N filtered-NOESY (Left) and the usual unfiltered water NOESY (Right). Both were done at 10°C (mixing time 300 ms, 100 mM NaCl, pH 6.5). The C13, C14, C15, and C17 cross peaks in the unfiltered water NOESY are between the two C amino protons and the G imino protons in the G⋅C base pairs for the stem. The C10 cross peaks are from the intermolecular G11⋅C10 base pair. Only the G11⋅C10 cross peaks are seen in the left spectrum. (B) A comparison between the 2D 13C-12C HMQC-NOESY-HMQC (Left) and the regular D2O NOESY (Right) in 100 mM NaCl, pH 6.5. Only cross peaks with black boxes in the right spectrum appear in the left spectrum showing the intermolecular NOEs; this indicates intermolecular interactions between A9H2 and C13 ribose protons.
