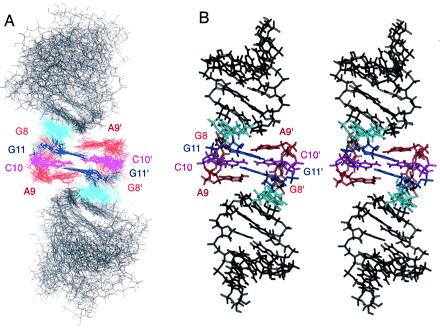
Figure 4.

The structure of the H3–18 kissing complex. (A) The superposition of the 12 lowest energy structures, the curvature and the joining angle of the two stems are variable, although each stem shows reasonable rms deviation when superimposed separately (Table 1). The loop closing base pair A7⋅U12 is featured in sky-blue. (B) A stereoview of the averaged and energy-minimized structure of the H3–18 kissing complex.
