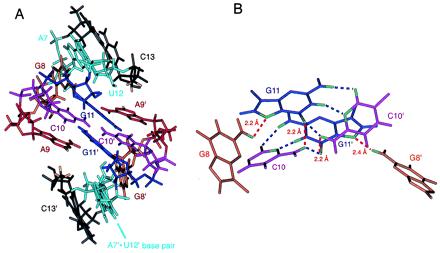
Figure 5.

The structural characteristics of the H3–18 kissing complex. (A) A close view of the kissing loop region. The protons involved in the strong cross-strand interactions (A9 H2 and C13 H4′, H5′/5′′) are shown in yellow. (B) The network of hydrogen bonds and possible hydrogen bond-like electrostatic interactions around the intermolecular G⋅C base pairs. The blue lines represent the observed hydrogen bonds that are typical in Watson–Crick G⋅C base pairs, and the red lines represent the hydrogen bond-like strong electrostatic interactions.
