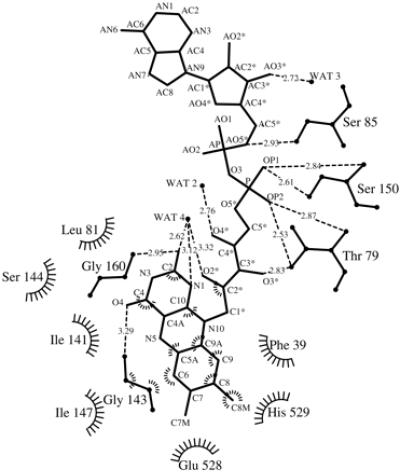
Figure 3.

Schematic diagram of d-LDH interactions with the FAD cofactor was created by using the program ligplot (42). All van der Waals interactions and hydrogen bond contacts to the FAD cofactor (Middle) are contributed solely from residues of the FAD-binding domain. The residues that form hydrogen-bonds to the FAD are shown in ball-and-stick representation. Hydrogen bonds are presented as dashed lines and the interatomic distances are shown in angstroms. The residues that form van der Waals contacts with the FAD are depicted as labeled arcs with radial spokes that point toward the ligand atoms with which they interact.
