
Figure 4.
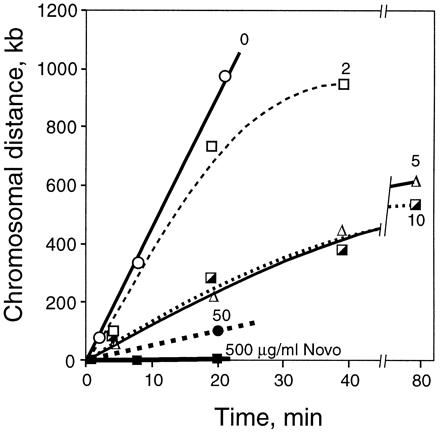
Rates of chromosomal replication supported by gyrase and topo IV. acrA dnaC2 cells were synchronized, and the position of the replication forks was determined by using hybridization to a genomic microarray as shown in Fig. 3. The plots show the average distance of the two forks relative to their respective positions at the time of novobiocin addition (time 0). Thirty minutes after the shift to 30°C to restart replication, novobiocin was added to 0 (○), 2 (□), 5 (Δ), 10 (┌), 50 (●), or 500 (▪) μg/ml. The times plotted are after addition of drug. The initial slopes (between 0 and 20 min) of the curves are: 0 drug, 45 kb/min; 2 μg/ml novobiocin, 35 kb/min; 5 and 10 μg/ml, 13.5 kb/min; 50 μg/ml, 5.1 kb/min; and 500 μg/ml, 0 kb/min.