
Figure 6.
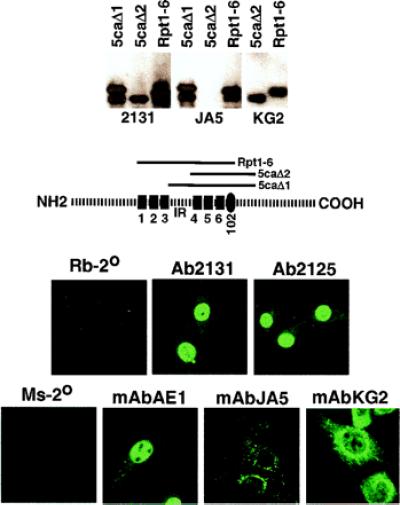
Immunofluorescent localization of C1 factor processing. (Upper) Aliquots of the illustrated bacterially expressed C1 proteins were resolved by SDS/PAGE, and transferred blots were probed with the indicated polyclonal or monoclonal sera. (Lower) 3T3 cells were stained with the indicated anti-C1 polyclonal or monoclonal sera. Rb-2° and Ms-2° are controls stained only with secondary antibodies.