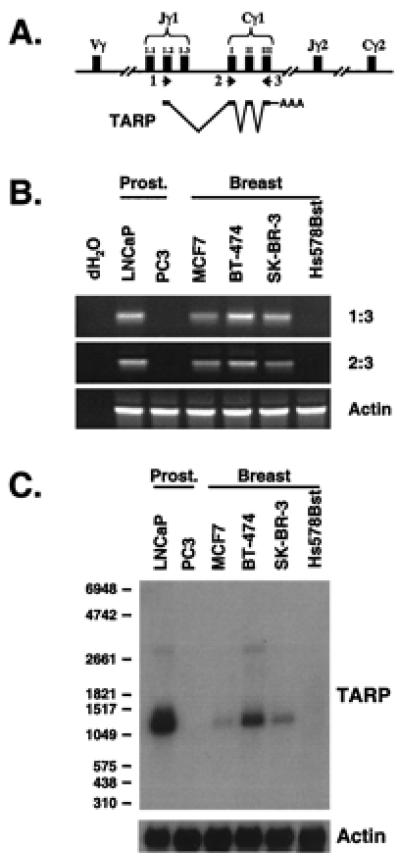
Figure 5.

The TARP transcript found in the breast cell line is the same as the prostate-specific form. (A) Schematic of the TCRγ locus and how TARP is transcribed and spliced in prostate cells. Primers used for RT-PCR analysis in B are indicated. (B) RT-PCR analysis of TARP mRNA expression. PCRs with TARP primers 1 and 3 (Top), TARP primers 2 and 3 (Middle), or actin primers (Bottom) were performed with cDNAs derived from prostate cell lines (LNCaP and PC3) and breast cell lines (MCF7, BT-474, SK-BR-3, and Hs578Bst). RT-PCRs performed without template are indicated as dH2O. PCR products (20%) were run on a 1% agarose gel and visualized by ethidium bromide staining. (C) Northern blot analysis of TARP transcripts. Poly(A) mRNA (2 μg) from prostate cell lines (LNCaP and PC3) and breast cell lines (MCF7, BT-474, SK-BR-3, and Hs578Bst) were analyzed by using a constant domain fragment as probe. The autoradiograph was generated after a 24-h exposure (Upper). The same filter was stripped and analyzed with a human β-actin RNA probe to verify equal loading. The autoradiograph was generated after a 1-h exposure (Lower). RNA size markers in the nucleotides are indicated on the left.
