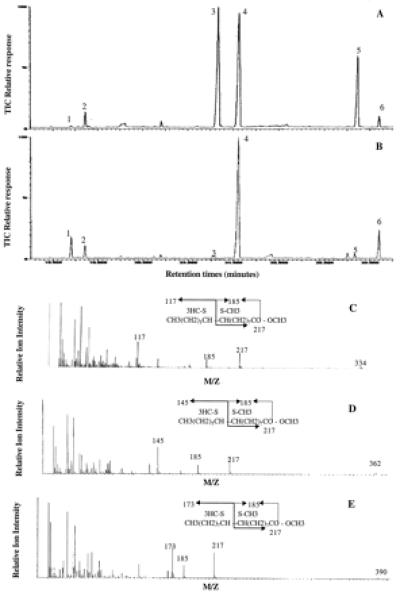
Figure 4.

Identification of monounsaturated fatty acid resulting from the Tai desat1 and desat2 gene expression in yeast fatty acid methyl esters of yeast transformed with Yeptaidesat1 (A) and Yeptaidesat2 (B) were analyzed by GC/MS. The common peaks were identified as Δ9 C14:1 (peak 1), C14:0 (peak 2), Δ9 C16:1 (peak 3), C16:0 (peak 4), Δ9 C18:1 (peak 5), and C18:0 (peak 6). Mass spectrum of the DMDS adducts of 0.9 monounsaturated fatty acid methyl esters were represented: Δ9–14 Me:DMDS (C), Δ9–16 Me:DMDS (D), and Δ9–18 Me:DMDS (E). These mass spectra exhibit the characteristic Δ9 unsaturated fragments ions at m/z 217 and 185.
