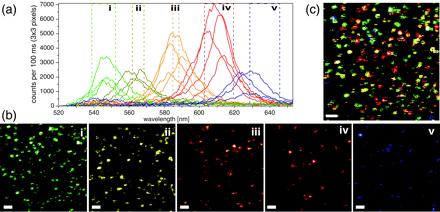
Figure 2.

NC multicolor imaging. Scans of a mixture of four NC samples (ensemble peak emissions: 540, 575, 588, and 620 nm). (a–c) 10 × 10 μm2 scan (pixel size, 78 nm; scale bar, 1 μm). (a) A representative collection of individual NC spectra (≈20 nm FWHM) obtained from the integrated data of 3 × 3 pixels. Despite their overlap, five orthogonal spectral bands (i to v) could be defined. (b) Five false-color images corresponding to the spectral bands defined in a. (c) Overlay of the five perfectly registered images of b.
