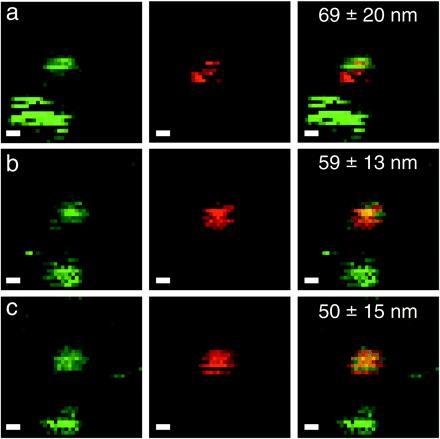
Figure 5.

Blinking NC colocalization. Same mixture and parameters as in Fig. 4 (2 × 2 μm2 field of view; scale bar, 200 nm). The same field of view was acquired repeatedly, with a 2-min interval corresponding to the duration of the scan. A slight drift can be observed between the first and second image. Measured distance ± error bar (95% CL) are indicated on the dual-color images. One of the two green NCs in the lower left corner goes into a prolonged dark state in b and c.
