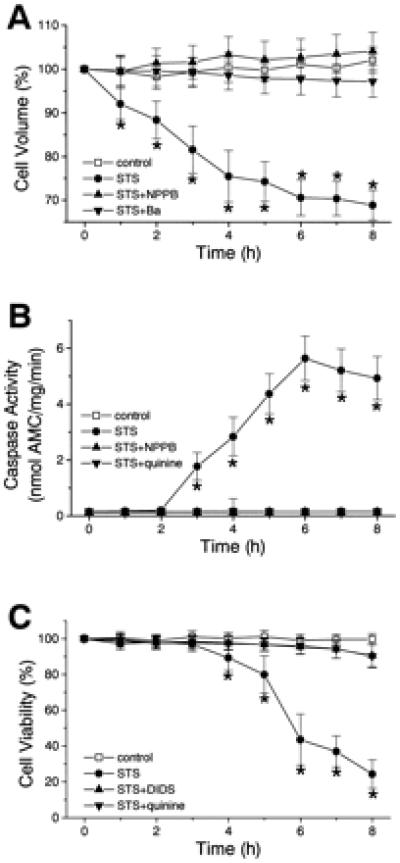
Figure 6.

The time courses of changes in the mean cell volume (A), caspase-3 activity (B), and cell viability (C) in control (□) and STS-induced apoptotic cells (filled symbols) in the absence (●) or presence of a Cl− channel blocker (▴) or of a K+ channel blocker (▾). After a 4-h treatment with STS, bimodal cell volume distribution was observed presumably because of formation of apoptotic body. Cell viability was assessed by trypan blue exclusion. *, P < 0.05 vs. control.
