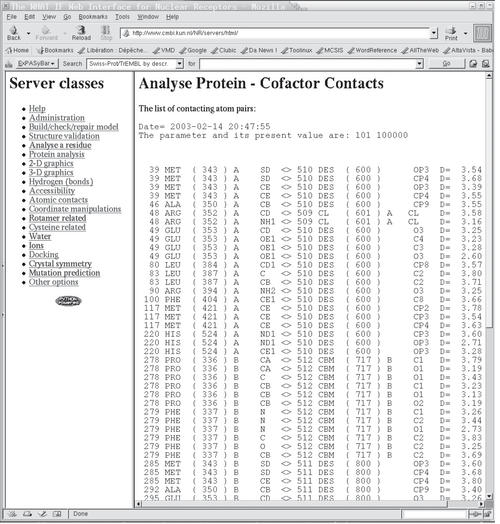
Figure 2.
NRSAS output screenshot. The left frame lists all 19 classes of options. The right frame shows the results of the server run, as illustrated in Figure 1. From left to right the residue number, residue type, PDB identifier of residue, chain identifier and name of atom making the contact are indicated. The left five columns are for the atom of the macromolecule; the next five columns are for the atom of the ligand. The right column gives the inter-atomic distance in Ångstrom.

