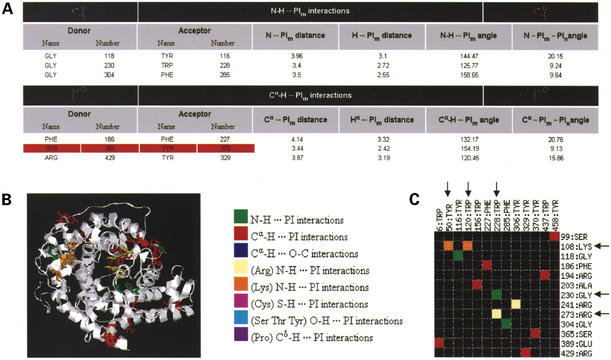
Figure 2.
Sample output for glucoamylase (PDB code: 1GAI, 1.7 Å resolution structure). (A) The HTML table provides values for the different parameters for each type of non-canonical interactions observed in the structure. A red background is indicative of bad contacts in the structure. (B) An image generated by the server using RasMol. It highlights the different non-canonical interactions in the structure according to the color code given in the key for (B) and (C). Residues involved in a non-canonical interaction are displayed in stick representation. Users can download a PS or a PNG file of the image as well as the RasMol script used to generate the image. (C) A schematic interaction matrix provides a quick way of identifying residues involved in multiple interactions. Acceptor residues are shown on the X-axis and donor residues on the Y-axis. In this case, we can see that Lys:108 is involved simultaneously in two N-H···π interactions with Tyr:50 and Trp:120. Similarly, Trp:228 is involved in two different types of interactions, a main chain N-H···π interaction with Gly:230 and a side chain N-H···π interaction with Arg:273.

