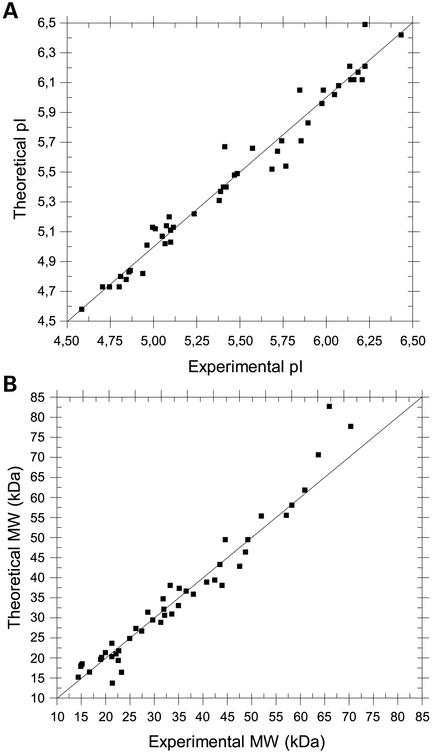
Figure 3.
Comparison between calculated and experimentally obtained pI and MW values for 47 randomly selected proteins from Pseudomonas aeruginosa. 2D PAGE experiments were performed as described before (7). The proximity of the data points to the 45° line is a measure of agreement between the experimental and calculated values. The correlation coefficient between these values is 0.98 for both pI and MW. The identity of the employed proteins is given in the Supplementary Material.

