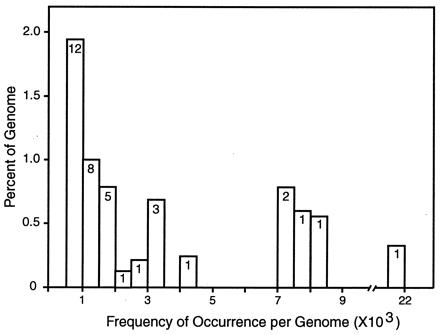
Figure 2.

Fraction of the S. purpuratus genome in families of repetitive sequence over a range of frequencies. The matches from an all-to-all comparison of 37,187 STCs were listed by score, and, starting with the highest scores, individual sequences and all of those that matched at hybridization criterion (see text) were set aside into families. The matching regions of the family members were summed to estimate how many nucleotides are present in the sequences of each family. The families were classified by frequency in intervals of 500, and the total matching length was compared with the genome, correcting for the fraction of the genome in the STC sample. Vertical axis is the percentage of the genome in repeat families in each frequency domain. Horizontal axis is the genomic frequency. The numbers in the histogram boxes are the numbers of distinct repeat families in each frequency domain. There are many additional families in the 2- to 500-copy frequency domain, but because of limited sampling in this small fraction of the genome, neither their frequencies nor the fraction of the genome that they account for can be calculated accurately yet.
