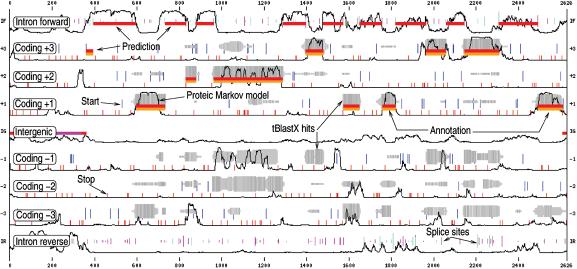
Figure 2.
An example of the graphical output of EUGÈNE'HOM: the sequence is on the x axis. The y axis corresponds to possible predictions. From top to bottom: intronic forward, frame 3, 2, 1 coding regions, then intergenic regions (IG) then frame -1, -2, -3 coding regions, then intronic reverse. In-frame START codons are represented as blue vertical lines. The longer the line, the better the score of the START. In-frame STOP codons are represented as small red vertical lines. Splice sites are visible on the intronic tracks as green and magenta vertical lines whose length indicates the site score. Thin black lines represent the smoothed normalised proteic coding/non coding score. HSP clusters are represented as grey blocks whose thickness is proportional to the number of hits at a given position and whose darkness is proportional to the homology score at this position. The GFF annotation provided by the user is visible as orange blocks. The prediction itself is visible as red blocks. In this example, available on the web site, EUGÈNE'HOM predicts a gene structure that matches the annotation.

