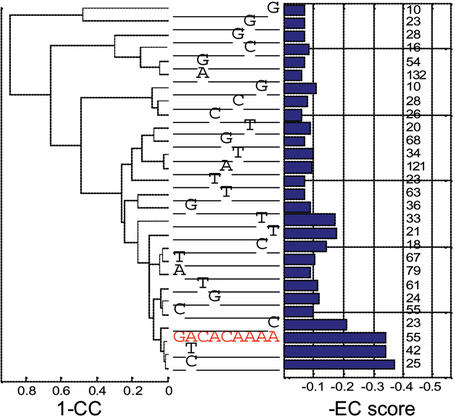
Figure 2.
A modified version of the Combinogram display designed to capture the effect of single nucleotide substitutions in regulatory regions on gene expression patterns. In this display, as in the original Combinograms, we represent the similarity of expression profiles between gene sets (1-correlation coefficients of their expression profiles, left side of the display) and within sets of genes (the EC score, right side of the display). The middle section displays the different promoter sequence elements shared among all the genes that are represented by each row of the display. The red motif is the consensus sequence and it represents all the genes that have a perfect match to it. The rest of the rows represent genes that have single substitutions relative to the consensus, with a ‘-’ indicating same nucleotide as the consensus, e.g. the bottom row represents the genes that have a GCCACAAAA motif instead of the consensus. The numbers next to the EC bars represent the number of genes that correspond to each row.

