
Figure 1.
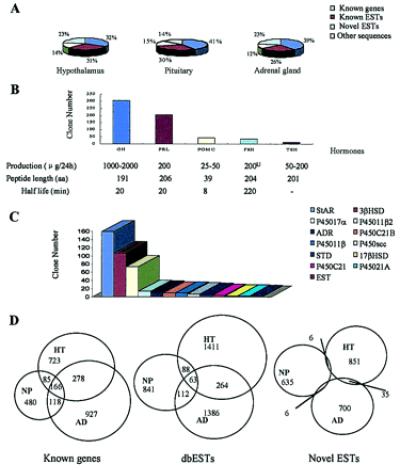
Gene expression profile in whole HT, NP, and AD. (A) Schematic chart of ESTs from HT (8,876 ESTs), NP (7,221 ESTs), and AD (9,875 ESTs) libraries. (B) The order of gene expression levels of five classical NP hormones. Corticotropin was grouped into POMC. Real-time PCR performed for GH, POMC, and TSH generated gene expression levels (32 × 105, 5.9 × 10⁵, and 2.4 × 10⁵ copies/100 ng RNA, respectively, P value all < 0.001) proportional to those estimated by EST copy number. (C) The order of steroids biosynthesis-related enzymes and proteins in AD. StAR, steroidogenic acute regulatory protein; 3βHSD, type II 3β hydroxysteroid dehydrogenase/5-δ-4-δ isomerase; P450 17α, cytochrome P450, subfamily XVII (steroid 17α-hydroxylase); P45011b2, cytochrome P450 XIB2 (aldosterone synthase); ADR, adrenodoxin; P45°C21B, 21-hydroxylase B; P45011β, cytochrome P450 11β; P450scc, cholesterol side-chain cleavage enzyme P450scc; STD, dehydroepiandrosterone sulfotransferase; 17βHSD: 17-β-hydroxysteroid dehydrogenase; P45°C21, steroid 21-hydroxylase [P450(C21)]; P45021A, 21-hydroxylase A; EST, estrogen sulfotransferase. (D) Overlapping of EST clusters corresponding to known genes, known ESTs, and novel ESTs expressed in HT, NP, and AD.