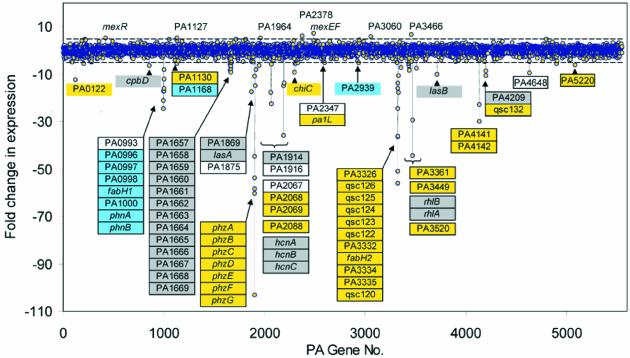
Fig. 3. Effect of furanone C-30 on genome-wide gene expression profile of P.aeruginosa. Differential gene expression in planktonic cultures of P.aeruginosa PAO1 in response to 10 µM C-30 analyzed by microarrays. Positive values represent C-30-induced genes. Negative values indicate C-30-repressed genes. The dashed lines indicate 5-fold induction or repression. Genes significantly affected by C-30 are indicated. The color coding of the individual genes indicates which of the two QS systems are required for induction: blue, LasR-controlled genes (activated by addition of only OdDHL); gray, both LasR and RhlR are required for full expression (activated by OdDHL, and further induced by addition of BHL); yellow, RhlR-controlled genes (genes induced only by simultaneous addition of OdDHL and BHL). C-30-regulated genes recorded as non-QS-controlled are not colored. Data represent samples retrieved at an OD600 of 2.0.

An official website of the United States government
Here's how you know
Official websites use .gov
A
.gov website belongs to an official
government organization in the United States.
Secure .gov websites use HTTPS
A lock (
) or https:// means you've safely
connected to the .gov website. Share sensitive
information only on official, secure websites.
