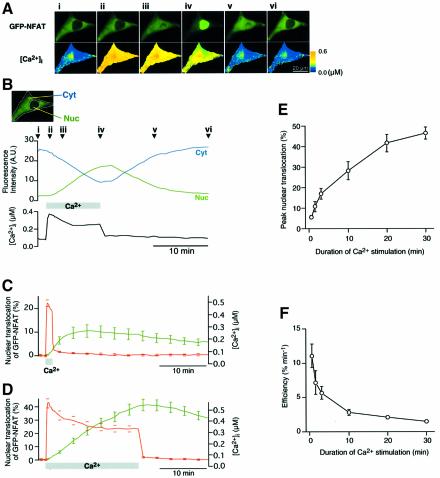
Fig. 1. Imaging of Ca2+-dependent nuclear translocation of GFP–NFAT. (A) Time-lapse images of GFP–NFAT and [Ca2+]i at various time points during and after Ca2+ stimulation as indicated in (B). (B) Changes in GFP fluorescence intensity of the cell shown in (A) in the cytoplasmic region (indicated as Cyt) and the nuclear region (Nuc) are plotted with the change in [Ca2+]i. (C and D) Time courses of GFP–NFAT translocation and [Ca2+]i upon Ca2+ stimulation for 1.5 min [(C), n = 10] or 20 min [(D), n = 8] (mean ± SEM). The ranges of errors are shown only at selected time points for clarity. (E) Dependence of the peak extent of GFP–NFAT nuclear translocation on the duration of Ca2+ stimulation (mean ± SEM; n = 8–21). (F) Efficiency of GFP–NFAT nuclear translocation. Peak nuclear translocation of GFP–NFAT per unit duration of Ca2+ stimulation was plotted against the duration of Ca2+ stimulation.

An official website of the United States government
Here's how you know
Official websites use .gov
A
.gov website belongs to an official
government organization in the United States.
Secure .gov websites use HTTPS
A lock (
) or https:// means you've safely
connected to the .gov website. Share sensitive
information only on official, secure websites.
