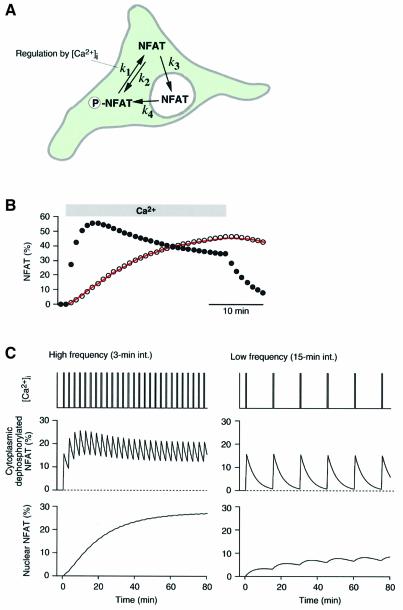
Fig. 3. Model of Ca2+-dependent nuclear translocation of NFAT. (A) Schematic illustration of a model of NFAT translocation. NFAT assumes one of the three states, cytoplasmic phosphorylated, cytoplasmic dephosphorylated or nuclear transported. Rate constants are defined as indicated. The dephosphorylation rate constant (k1) was assumed to be regulated by [Ca2+]i. (B) Model fitting (open circles) to the nuclear translocation time-course of NFAT (continuous trace). Model prediction of the time-course of cytoplasmic-dephosphorylated NFAT is also shown (filled circles). Model para meters used: k1, 0.359/min (during Ca2+ stimulation); k2, 0.147/min; k3, 0.060/min; and k4, 0.035/min. (C) Model prediction of NFAT translocation during Ca2+ oscillation. High-frequency Ca2+ oscillation maintains dephosphorylated NFAT in the cytoplasm and induces significant nuclear translocation. Low-frequency oscillation results in intermittent dephosphorylation and induces only slight nuclear translocation of NFAT. Model parameters were the same as those used in (B).

An official website of the United States government
Here's how you know
Official websites use .gov
A
.gov website belongs to an official
government organization in the United States.
Secure .gov websites use HTTPS
A lock (
) or https:// means you've safely
connected to the .gov website. Share sensitive
information only on official, secure websites.
