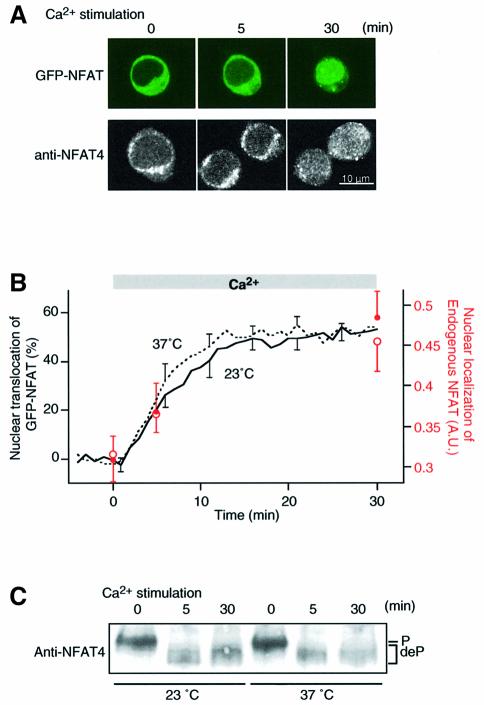
Fig. 5. Activation kinetics of endogenous NFAT in Jurkat T cells. (A) Time-lapse images of GFP–NFAT translocation (upper panel) and samples of anti-NFAT4 immunofluorescence images (lower panel) obtained at the indicated time-points after Ca2+ stimulation. (B) Time courses of nuclear translocation of endogenous NFAT4 (circles) and GFP–NFAT (lines) upon Ca2+ stimulation. Experiments were carried out at room temperature (open circles, n = 9–12; continuous line, n = 7) and 37°C (filled circles, n = 11–17; dashed line, n = 6) (mean ± SEM). The ranges of errors are shown only at selected time points for clarity in the GFP–NFAT experiments. (C) Dephosphorylation of endogenous NFAT4 following Ca2+ stimulation. Whole-cell lysate prepared from Jurkat cells stimulated with Ca2+ at either room temperature or 37°C were used for western blotting with rabbit antiserum raised against NFAT4. Dephosphorylation of NFAT4 resulted in the mobility shift of the immunoblot bands.

An official website of the United States government
Here's how you know
Official websites use .gov
A
.gov website belongs to an official
government organization in the United States.
Secure .gov websites use HTTPS
A lock (
) or https:// means you've safely
connected to the .gov website. Share sensitive
information only on official, secure websites.
