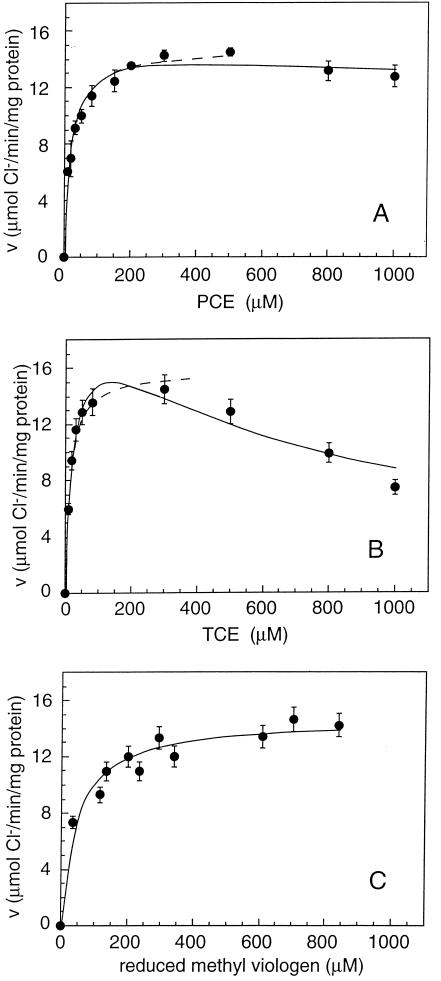
FIG. 4.
PCE-RDase activity (v) as a function of the concentration of PCE (A), TCE (B), and reduced methyl viologen (C). In each case the solid line is the best fit obtained by using the model with inhibition constants for noncompetitive inhibition by PCE and TCE of 8.3 and 0.76 mM, respectively. The dashed lines are fits according to Michaelis-Menten kinetics without inhibition.

