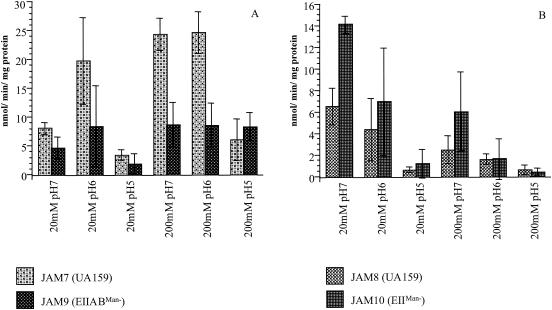
FIG. 7.
CAT-specific activity driven by gtfBC and ftf promoters in the wild-type and manL− backgrounds under carbohydrate excess (200 mM glucose) and carbohydrate-limiting conditions (20 mM glucose) at pH 7, 6, and 5. Values shown are means ± SD from three independent chemostat runs. The results are expressed as nanomoles of Cm acetylated per minute per milligram of protein. (A) CAT activity driven by gtfBC promoter; (B) CAT activity driven by ftf promoter.

