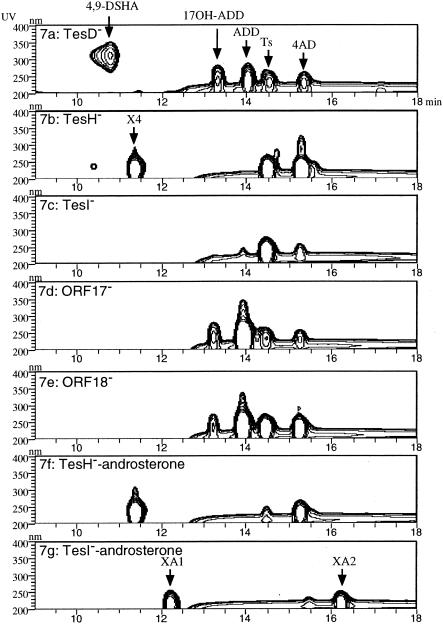
FIG. 7.
Intermediate compounds accumulating in the cultures of the gene disruption mutants of TA441 incubated with testosterone (a through e) or androsterone (f and g). Data are represented in three-dimensional HPLC charts (the vertical axis indicates wavelength, the horizontal axis indicates reaction time, and the UV absorbance of each compound is represented in contour). (a) HPLC chart of the culture of the TesD disruption mutant grown on the mixed LB-plus-C medium with testosterone (presented as authentic). (b through g) HPLC charts showing cultures of the gene disruption mutants of tesH (b), tesI (c), ORF17 (d), and ORF18 (e) incubated with testosterone and of the gene disruption mutants of tesH (e) and tesI (g) incubated with androsterone. Ts, testosterone; 17OH-ADD, 17-hydroxy-1,4-androstadiene-3-one.

