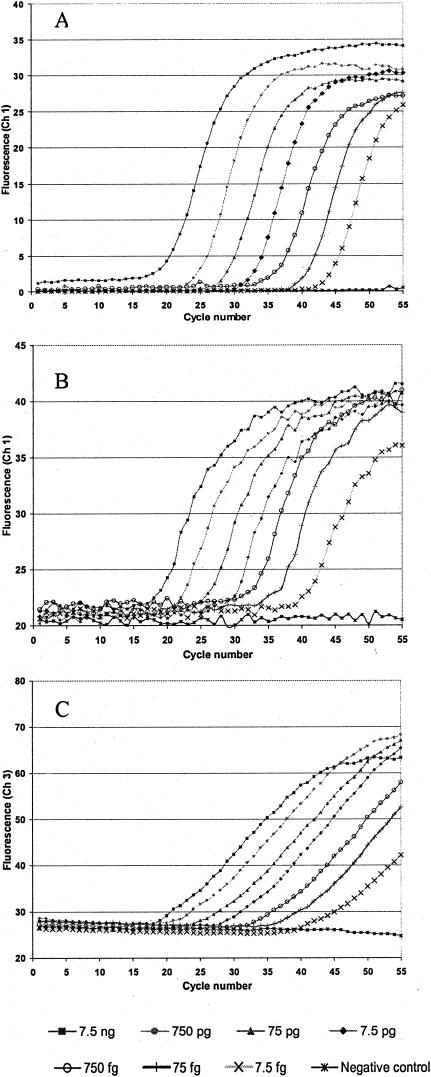
FIG. 1.
Amplification curves for SYBR Green I (A), 5′-exonuclease (B), and hybridization probe (C) assays. Dilutions of B. abortus genomic DNA (NADC strain 1144) were used as a template for each reaction. A 10-fold dilution series (from 7.5 ng down to 7.5 fg) was analyzed in triplicate. LightCycler Data Analysis software, version 3.1.1.06i, was used to generate curves by plotting cycle number (x axis) against fluorescence, read in channel 1 for SYBR Green I and 5′-exonuclease assays and channel 3 for the hybridization probe assay. For clarity, only one curve per concentration is depicted, with concentrations decreasing from left to right.

