
Figure 1.
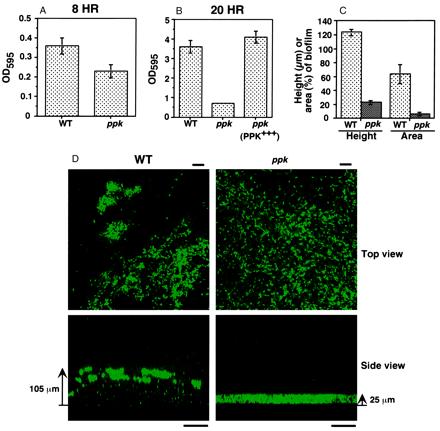
Biofilms of P. aeruginosa WT and ppk mutant strains in static cultures (A, B, and D) and flow-through continuous cultures (C). (A and B) Degree of surface attachment of bacteria at 8 h (A) and at 20 h (B) by staining with crystal violet (average ± SEM of four measurements). (C) Height of biofilms (in μm) (average ± SEM for 75 measurements in three separate experiments) and surface area coverage of biofilms (as percentage of total flow-cell area) (average ± SEM of 15 measurements in three separate experiments). (D) Epifluorescence and SCLM of static biofilms of the WT and ppk mutant containing the GFP expression vector pMRP9–1 (18). The top view epifluorescence micrographs were taken (with a X60 lens) at 5 μm from the substratum. Bar is 10 μm. The side views were acquired by SCLM (with a X20 lens). Bar is 50 μm. Bacterial cells contain GFP and the color intensity correlates with cell density. Strains: WT, PAO1; ppk, PAOM5; and ppk (PPK+++), PAOM5 containing pHEPAK11.