Abstract
The web software SIC provides a tool to search for short inverted segments (length 3–5000 bp) in a DNA sequence. The sequence is assumed to follow a Markov model. A statistic which is sensitive to inversion is presented. Searching inverted segments is done by a scanning approach after the user specifies the size of the scanning window and the order of the Markov chain. A list of the highest score segments is given with an assessment of the randomness of the result. SIC can be accessed via the URL: http://stat.genopole.cnrs.fr/SIC/.
INTRODUCTION
At the DNA level, classical bioinformatic tools such as Blast and its derivatives usually take into account three types of genetic alterations, called operations. The first is the substitution of a nucleotide by another, the second is the insertion of new nucleotides and the last is the possible deletion of existing nucleotides. Those three operations are insufficient to model the biological reality of DNA evolution.
Recombinations can also occur and large pieces of DNA can be exchanged or reversed on that occasion. Several algorithms can estimate the ‘history’ between two genomes which share the same genes but they are in a different order and not necessarily on the same strand (1).
Similar phenomena can occur for short segments of DNA as illustrated by Figure 1. Goldstein et al. (2) studied their consequences on proteins. Supposing a codon is still a codon after reversing, they find a significative excess number of words (of size 3–7 amino acids) which are inverse complementary of themselves in data banks. They conclude to the existence of short reversed complementary sequence in the coding of DNA during evolution. As Goldstein did, we call an inverted complemented DNA a dincom (for Dna Inverse Complementary).
Figure 1.
An example of returned complemented segment (dincom) in a DNA sequence. W, Watson; C, Crick.
The web tool SIC (Scan Inverse Complementary) is intended to detect short reversed complemented segments in a DNA sequence. The user chooses a priori the size of an eventual dincom. A score is then given to each segment of the sequence. A probabilistic approach is applied to assess the randomness of the results found.
PRINCIPLE
The sequence is modelled by a Markov chain X=(X1,…, Xn). We note Q+(u, v) with u, v∈{a, c, g, t} the probability that u is followed by v. We assume that this probability does not vary along the sequence. The stationary distribution of each letter is denoted by μ(u).
If we reverse this chain, we define X −=(Xn,…, X1)=(X −1,…, X −n). We can show that X − is also a Markov chain with the same stationary distribution as X. The probability Q−(v, u) that v is followed by u for all u, v∈{a, c, g, t} can be calculated using Q and μ:
The passage to the complementary of the inverse sequence does not present any particular methodological problem as it is a bijective operation.
The sequence of interest is noted s1,…, sn. For each segment of size l<n, we can calculate for i=1,…, n−l+1:
where Prob+(s1,…, sl) (resp. Prob−(s1,…, sl)) is the probability to observe s1,…, sl from the Markov chain X (resp. X −).
Large values of Ti are associated to segments which are most likely from X − than from X. If a dincom occurs at position i, we will observe a peak on the plot of Ti. Notice that the effective size L of the return can be greater than l. In this case, a series of segments of size l will be more probably issued from X − than from X and we will observe a series of high-valued Ti.
To assess the statistical significance of the result, we are interested in the distribution of the highest value of Ti:
when no return occurs.
This distribution depends on the distribution of Ti. If l is small (say <10) we can compute the 4l different segments and calculate the exact law of Ti. If l is large (say >10) it can be shown that the distribution of Ti is well approched by a Gaussian distribution, because Ti is a linear function of the counts of the word of length order+1 (3). We can also calculate its mean and its variance under both directions. According to these two cases, we use two different approximations for the distribution of Sn. When l is small, we adapt the product-type approximation of Glaz and Balakrishnan (4). It uses a Monte-Carlo approach and is rather computer intensive. When l is large, we use the convergence of the maximum of Gaussian variables to a Gumbel distribution, as the sufficient condition r(n) log(n) tends to 0 as n tends to infinity is met (see theorem 2.5.2 of 5). r(n) denotes the covariance function of Ti.
As Ti has a finite support, the distribution becomes degenerated when n tends to infinity. To avoid this, we suppose that the minimal frequency of returned segments is 1 over 10 000 bp.
The power of the detection depends on the degree of ‘orientation’ of the sequence, i.e. the fact that the distribution of Ti in the positive sense is different from the distribution in the negative sense. To have an idea of this, SIC calculates the total variation distance D between the Markov chain in the positive direction and the Markov chain in the negative direction.
D varies between 0 and 1. D=0 means that the distribution of the chain is exactly the same in both senses. The more D approaches one, the more the chain is oriented and SIC is efficient.
THE INTERFACE OF SIC
Input
SIC takes four input parameters. The first is the sequence of interest in Fasta format. It is possible to use your own sequence or a sequence from our database. The second is the order of the Markov chain to use. For now, it is possible to use first or second-order Markov chains. The third is a list of at most five window sizes (parameter l) to be used to scan the sequence. This parameter can vary between the order of the Markov chain plus one and 5000 bp. The two last parameters are used to limit the number of results shown on the output page: the maximal number of segments with the highest scores and the maximal p-value to show.
Output
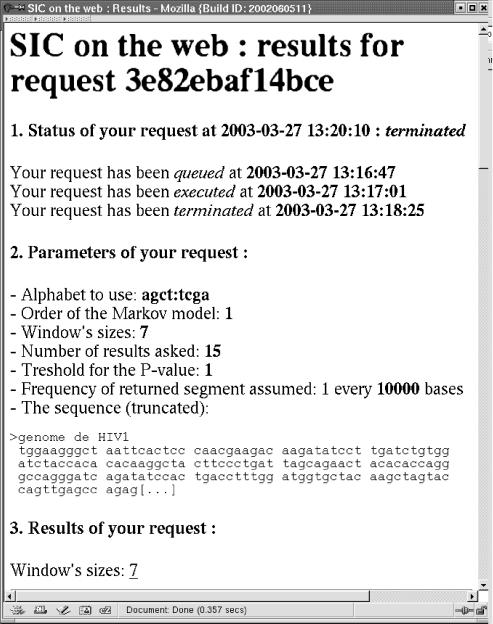
The first part of the output reminds you of the initial parameters. As an example, we choose to analyse the HIV genome with an order one Markov chain, and only one size for the scan window: 7. We wanted to see the 15 best score segments with no limits on the p-value (Fig. 2).
Figure 2.
First part of the output window. General information about the request.
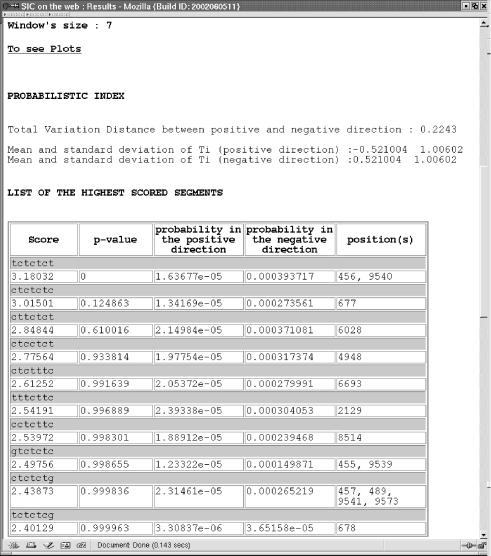
Then, for each scanning window size, two parts are displayed. The first part concerns numerical results (Fig. 3). Several indexes represent the degree of orientation of the Markov chain: the total variation distance D, the mean and standard deviation of Ti when the segment is generated from X + (positive sense) and from X − (negative sense). Then the list of the greatest values of the statistics Ti is given in decreasing order. Each statistic is described by the positions in the sequence where it was calculated, the segment of size l, the probability to observe this segment under the positive model and the negative model and an approximation of the probability Prob(maxi Ti<t) where t is the observed value of the statistic if no return had occurred.
Figure 3.
Second part of the output window. Numerical results presented here for the hiv-sequence with a scan window of size 7.
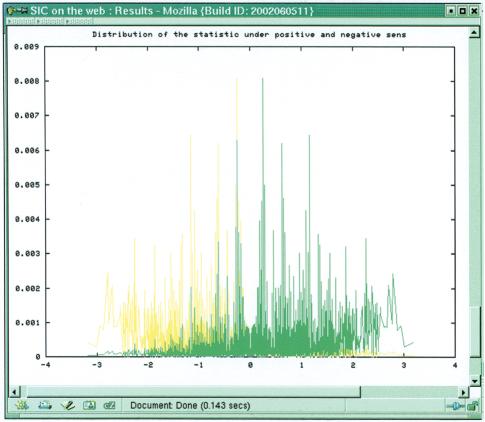
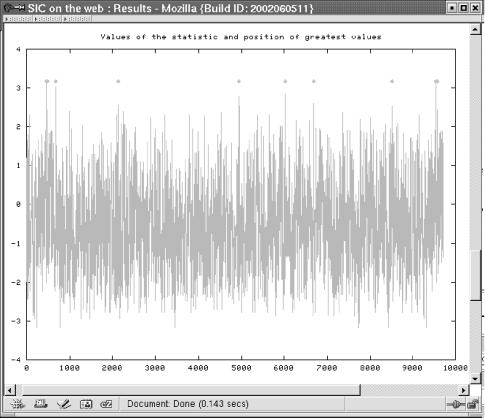
The second part displays two plots (Fig. 4). The series of Ti show where the statistic takes high values. Several asterisks highlight the position of the highest values. The next plot shows the distribution of Ti under the positive model and under the negative model. If l is ≤10 the exact distribution is shown, else the Gaussian approximation is shown.
Figure 4.
Second part of the output window. Results presented here for the hiv-sequence with a scan window of size 7. The upper graph shows the trace of the Ti. The lower graph presents the exact distribution of the statistics Ti under the positive model (red) and the negative model (green).
CONCLUSION
SIC provides tools to detect inverted segments in a DNA sequence. In practice, SIC estimates the parameters of the Markov chain on the sequence. We supposed that the sequence is long enough to allow sufficiently accurate estimations. for first and second-order Markov chains a length of 5000 bp should be sufficient.
For the moment it treats Markov chains of order 1 and 2. It is planned to implement higher orders and although to take into account an eventual phase of the Markov chain (for coding DNA). It is extremely important that the chain is oriented for SIC to give useful results. The total variation distance and the plot comparing the distribution of the statistic under both models are useful indexes. On eukaryotic complete genomes take care of the sense of replication. If an orientation exists, it should be in the sense of replication.
The approximations of the distributions of sn can be inaccurate. We are currently developing a more precise one.
The choice of looking 1 dincom every 10 000 bp is quite arbitrary for instance and could be easily changed. This only affects the distribution of sn but not the ranking of the scores.
REFERENCES
- 1.Pevzner P.A. (2000) Computational Molecular Biology: An Algorithmic Approach. MIT Press, London, UK. [Google Scholar]
- 2.Goldstein D.J., Muri,F., Saragueta,P. and Prum,B. (2000) Inverse complementary homologues of short cysteine signatures. CR Acad. Sci. III, 323, 167–172. [DOI] [PubMed] [Google Scholar]
- 3.Waterman M.S. (1995) Introduction to Computational Biology: Maps, Sequences and Genomes. Chapman and Hall, London, UK. [Google Scholar]
- 4.Glaz J. and Balakrishnan,N. (1999) Scan Statistics and Application. Birkhauser, Boston, MA. [Google Scholar]
- 5.Leadbetter M.R. and Rootzén,H. (1988) Extremal theory for stochastic processes. Ann. Probab., 16, 431–478. [Google Scholar]


